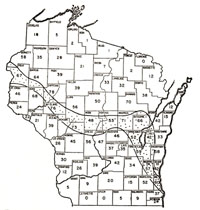
Maps at PEL; Then and Now.
Maps have always been important to the research at the Plant Ecology Lab. In his landmark book "Vegetation of Wisconsin" Dr. Curtis utilized a series of physical overlaid maps to establish the existence of his novel concept; the "tension zone".

Maps played a crucial role in the
development of the "tension zone".
Today, maps are just as important to our work at PEL. Constituting one of its primary roles Geographic Informations Systems (GIS) specialist Steve Horn has digitized and ortho-rectified numerous 1950's aerial photos in order to quantify and compare historic land use with that observed in current satellite imagery.
When coupled with the wealth of geo-referenced information from sources such as the US Geological Survey this database of old and new imagery can be used in an impressive array of applications. The maps listed in the link bar at left have been compiled to help provide background climate information across the state of Wisconsin. Our researchers use this information to provide context for their field data and help visualize environmental gradients which might be contributing to the observed trends.
Utilizing a suite of software our aerial photos, satellite imagery, and geo-referenced data files can be integrated to help researchers accurately locate sites and assess changes in large-scale weather patterns occuring over the intervening years.
Landscape quantification
In a process which would take years without the help of computers, we are now able to digitize different aspects of human land use over a whole landscape. Thanks to the abundance of 1950's aerial photos housed at the UW Madison Map Library, our researchers can accurately assess and quantify landscape use changes over the course of the last 50 years. These comparisons are currently being incorporated into data collected from original PEL sites to assess the effect of changes in surrounding lands on those observed in our sites.

Example of a fully "Digitized" Satellite photo.
To accurately quantify these changes takes many hours of careful work creating
outlined "shape" files to overlay satellite imagery and aerial photos. The
computer is then able to calculate areas of a certain use category in a buffer
surrounding the selected site. Look for the details of this research soon in
our Forthcoming articles section on the publications
page.


